
Key Performance Indicators (Version 2)
Key Performance Indicators (KPI’s) are one of the more commonly used metrics to measure the success of businesses. KPI’s help track critical components of your business and measure progress against predefined goals. But KPI’s don’t simply need to look in the rear-view mirror measuring past performance; KPIs can also be predictive.
According to KPI.org:
“Key Performance Indicators are the critical (key) indicators of progress toward an intended result. KPI’s provides a focus for strategic and operational improvement, create an analytical basis for decision making and help focus attention on what matters most. As Peter Drucker famously said, ‘What gets measured gets done.’
Managing with the use of KPI’s includes setting targets (the desired level of performance) and tracking progress against that target. Managing with KPI’s often means working to improve leading indicators that will later drive lagging benefits. Leading indicators are precursors of future success; lagging indicators show how successful the organization was at achieving results in the past.”
One well-known and widely used KPI for growth businesses is year-on-year revenue growth. In practice, KPI’s are applied in almost every aspect of business—sales, marketing, customer service, finance—to name a few.
KPI’s for Revenue Management
At Veritec Solutions, we have leveraged both our broad experience in pricing and revenue management along with the experience and knowledge of industry experts (self-storage and beyond), to carefully develop a set of KPI’s specifically for revenue management. These KPI’s are now becoming incorporated into our overall methodology and technology solution, VRMS, that incorporates self-storage industry best practices. This integrated approach enables clients to automatically apply such best practices in an easy way.
Our recently introduced DASHBOARD provides at-a-glance KPI’s in both numeric and graphic forms. For example, clients can easily tell if their prices are below, at, or above the recommended rates. Additionally, they can obtain quick insight on whether or not “market demand” is unusually high or low. Such KPI’s can help a client determine whether they can charge more and likely still maintain (or increase) current facility utilization.
Or perhaps the client is charging too much, which may warrant further investigation into other KPI’s and metrics on facility utilization. Fine-tuning rents, utilization, and other metrics can have a dramatic, positive effect on revenues in the long term.
Graphical KPI’s For Easy Data Consumption
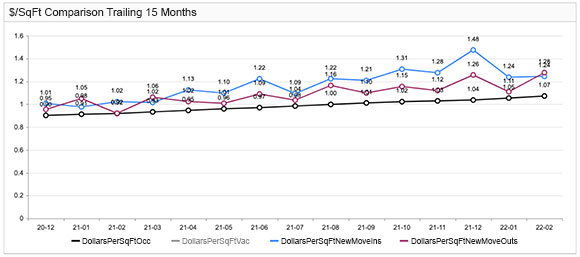
Consider another example, where a self-storage operator has seen relatively stable occupancy for the past 18 months. In such a situation, there are several core KPI’s of especially strong interest that revolve around revenue per square foot (or per square meter in some countries). Beyond revenue per available square foot (essentially a metric for total revenue), there are other detailed elements that can provide very useful insights, focusing on revenue per square foot of occupied units, on new customer move-ins, and on customers that recently moved out.
The graph below highlights how revenues of these three measures are changing over time. Further, by displaying all on the same graph, important relationships between the three are easily observed. For example, for most of the time period shown (i.e., from April 2021 through January 2022) the revenue per square foot from new move-ins exceeded the revenue per square foot of move-outs. Seeing that the relationship between these metrics has flipped in February 2022, may well lead the operator to pay close attention to whether this is just a temporary “blip” or the beginning of a trend that should be addressed.
These are only some of many relevant and actionable KPI’s that Veritec tracks for self-storage clients. As such, Veritec’s recently introduced DASHBOARD has already made a difference for many companies.
The DASHBOARD has enabled members of the senior management team to more easily access an individual store facility, select groupings of stores, and overall portfolio level information and trends like never before. Such access is helping these companies better spot trends and changes in trends, all the while facilitating more profitable decisions. This, as part of an overall disciplined, data-driven, decision-making methodology leads to increased revenues and profitability for those operators.