The Power of Data: What About Customer Move-Outs?
In a previous blog, we talked about understanding new customer move-ins. But what about when customers move out? This “flip side” key performance index (KPI) is equally important to understand because it is about losing customers.
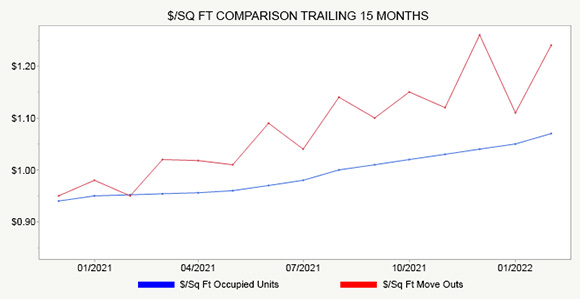
Analyzing similar data as in our prior move-in focused blog, we consider a self-storage operator who has experienced relatively stable occupancy for the past 15 months. We highlight two core KPI’s of especially strong interest based on revenue per square foot.
As was the case for move-ins, revenue per square foot of move-outs (when based on total square feet of a facility) is often an excellent and easily understood metric for understanding the impact of move-outs on total revenue. It “normalizes” revenue, so it is often a more robust metric when used in trend analysis and making comparisons across stores. For customer move-outs, we look at two aspects of revenue per square foot:
- Based on occupied units.
- Based on customer move-outs.
Analyzing Move-Outs in Isolation.
If we strictly focus on the red line, customer move-outs, we see that it bumps along with ups and downs depending on month:
- Notice the increases in $/Sq. Ft. in January, March, June, August, October, December of 2021, and February 2022.
- Conversely, there were decreases in $/Sq. Ft. of move-outs in the months of February, April, May, July, September, November of 2021, and January 2022.
- Although the year-over-year time frame is limited, there does not appear to be any cyclicality in the data presented. There was an increase in $/Sq. Ft. of move-outs in January 2021, followed by a dip in February. The opposite is true in 2022, where there was a dip in January, followed by an increase in February.
- The overall $/Sq. Ft. move-out trend is in an upward trajectory. That suggests the revenue loss associated with move-outs may be increasing. In isolation, this could be a disconcerting trend. As we shall see, however, this may not be the case.
Analyzing Move-Outs Relative to Occupied Units.
If we look at move-out data compared to occupied data, the black line, a different perspective emerges:
- Occupied revenues per square foot has steadily increased over time. That is a good thing, as the operator is gaining more revenue per square foot over time.
- If move-in rates and the rents of existing customers are increasing, then the $/Sq. Ft. of move outs would also naturally increase.
So, the pertinent question may be to compare the rates at which the $/Sq. Ft. of move-outs are increasing relative to rent increases and move-in rates.
What if Move-Out and Occupied Revenues Trend in Opposite Directions?
We noted there were months where move-out revenues increased over the previous month. Considered in isolation, it might seem that profitability will take a hit. Customers in units that are yielding higher revenue per square foot are moving out. It is worthwhile to consider why.
- Are the move-outs related to those customers that recently received a large rent increase?
- Are the move-outs from customers who recently moved in at higher rates?
- Are the move-outs from long-time customers that are paying higher rates than average?
Depending on how the above questions are answered, insights will be generated into whether any type of corrective action is needed. In addition, the type of corrective action needed, if any, will vary. We’ll discuss these considerations in more detail in future blogs.
Looking at customer move-outs is a continuation of a data-driven approach. By truly understanding the factors driving the move-out data, operators can significantly improve their overall revenues, and thereby profits, over time.